Mastering the art of AdWords requires a solid understanding of quality score. Why? There’s a direct positive correlation between quality score and pay per click (PPC) success.
Recently, I’ve written about how quality score optimization helps lower cost per click (CPC) and enables campaigns to achieve higher ROI.
The crazy part? AdWords hides crucial information on how your quality score has changed over time.
Today, I’ll show you a few different ways to track this special metric.
Finding Your Quality Score
If your quality score can dictate the competitiveness of your AdWords, why do many people seem to neglect it? Technically, this number isn’t published anywhere. It’s hidden in your AdWords account.
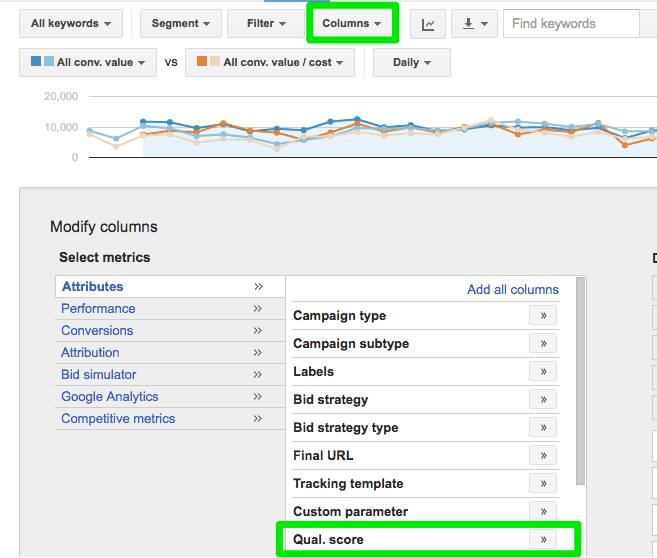
Follow these steps to display your keyword quality score in AdWords:
Now, what most people fail to realize is there are other important types of quality score (QS). There’s:
- Account-level QS
- Ad group QS
- Ad-level QS
- Landing page QS
- Mobile QS
However, keyword-level QS is the only visible number in the AdWords interface.
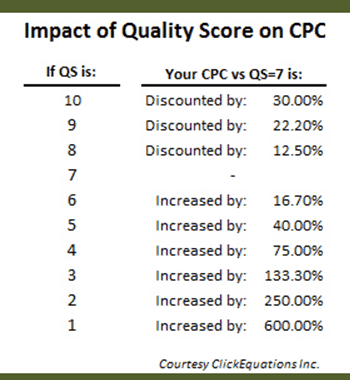
Google ranks keyword QS on a scale from 1 to 10, with 1 being the poorest and 10 being the highest. You should aim for a 7 or better keyword quality score. As I’ve mentioned before, here’s the post where I discussed the impact of quality score on CPC.
Quality Score is a Snapshot – and You Need to Track Change Over Time
Since various historical factors affect QS, the only way to improve it is to run a lot of ads that have better QS. When you look at your AdWords account, you can see graphs that show different metrics over time, such as CPC and number of clicks. However, you can’t calculate your QS advancement over time inside AdWords. Google makes it difficult to see your QS progress.
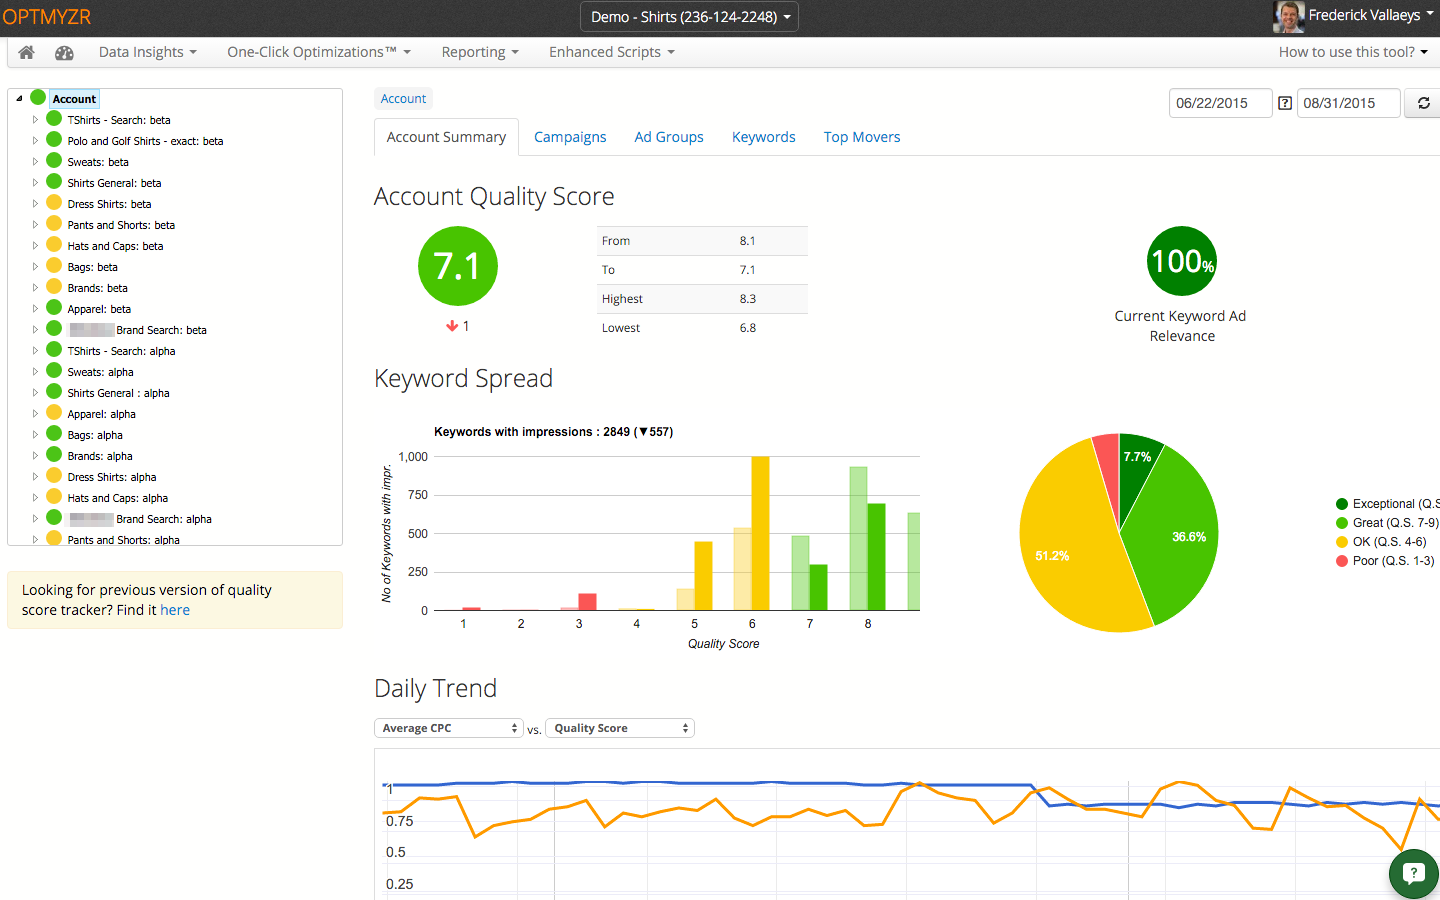
As you work on organizing your ad groups, you can’t rely on AdWords to know whether your QS is getting better or worse. You’ll need a tool that allows you to track QS over time. This tool should give you a snapshot every day and visualize QS progress for you. It should also help you prioritize. You should be able to see the biggest ad group with the lowest QS as well as the biggest ad group with the best QS.
3 Ways to Track Quality Score Over Time
Here are 3 ways to easily track your QS:
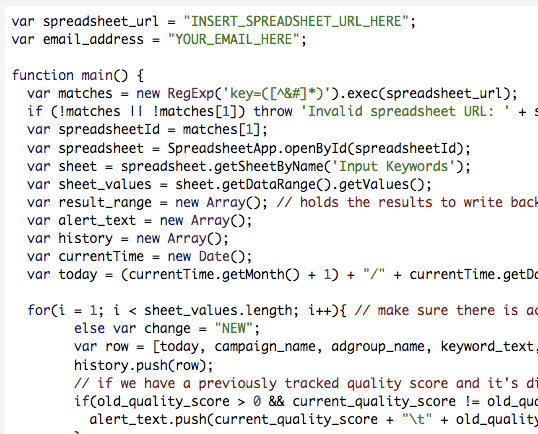
- Using an AdWords script is a great way to monitor your AdWords account and automate routine tasks. It basically downloads a snapshot every day and stores the results in a Google spreadsheet. Two great resources are a script by Martin Roettgerding and a script by Russell Savage.
- Tenscores is a good alternative to track QS. This app represents several key metrics visually such as total QS discount and total QS penalty.
- Like Tenscores, Optmyzr shows you the areas that can have the biggest impact on your bottom line, by prioritizing spend and quality score.
Why You Should Track Your Quality Score
Quality Score can be difficult to manage. There are tons of things that you can do to improve your QS. You can:
- add negatives
- run ad copy optimization
- reorganize your ad groups
- optimize your match types
How can you keep track of what changes made the biggest impact? You need to know the impact of your optimization. You need to measure the effectiveness of your effort as you go about creating new ad copy. You need all the help you can get.
These tools help simplify your QS optimization process. Not only do they list the QS of each keyword and ad group, but they also prioritize them for spends. This allows you to find the biggest opportunity and focus your efforts there. It’s a killer benefit as your account grows.


4 thoughts on “Day 30 of 100 Days of Adwords Help: How and Why to Track Your Quality Score”
Do any of the 3 ways to track QS score over time apply to Shopping campaigns?
@Preston,
Unfortunately, Google doesn’t display account-level & shopping PLA quality scores 🙁
What would be the advantages/disadvantages of one of the three options over the other?
Hey @richkisida:disqus
The software approach may be smoother / cleaner (since you’re paying someone else for the convenience of providing polished reports.
On the other hand, you can do it yourself for free, but may not look as pretty – and you’ll also be responsible for debugging.